Oil and Natural Gas Technical Analysis: Rebound Amid US Inventory Draw and Geopolitical Risks
Oil prices rebounded on a sharp US crude inventory draw, but bearish technical trends in WTI and natural gas persist, while the US Dollar Index consolidates near key support amid geopolitical uncertainty.
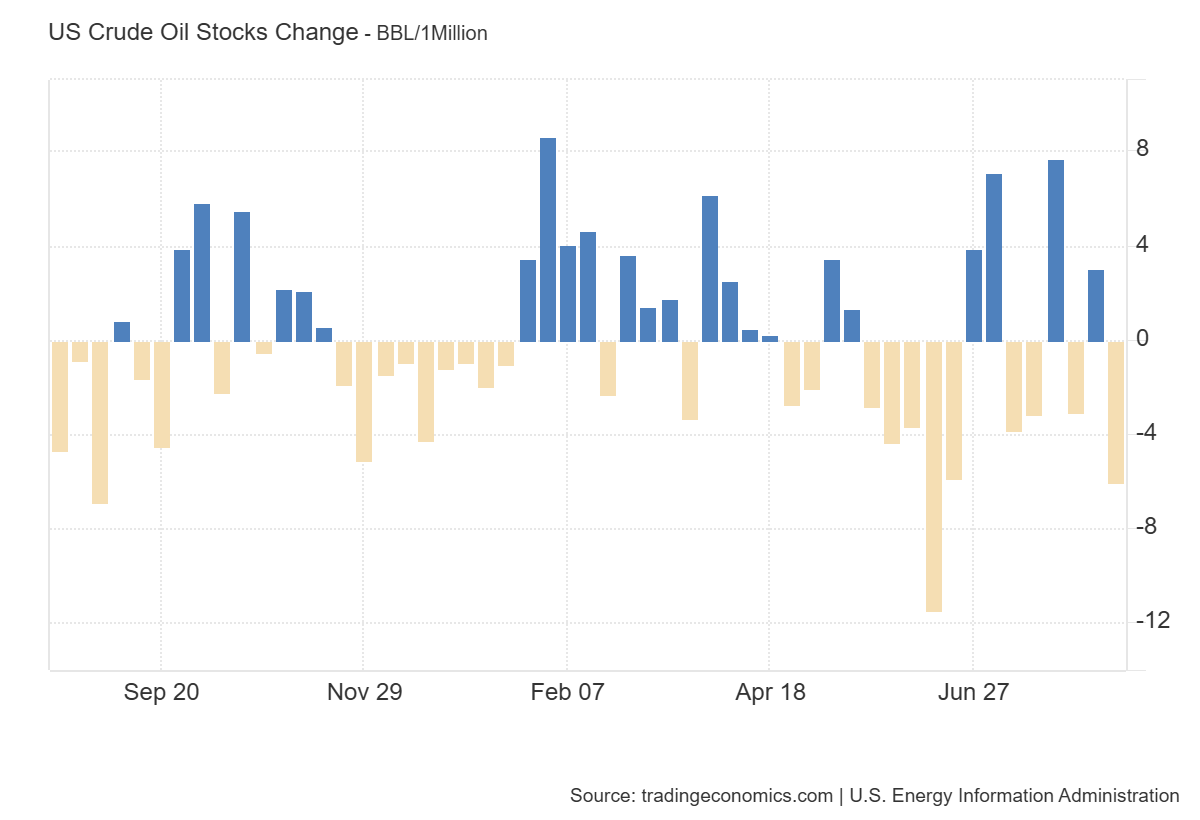
Oil prices rebounded on Wednesday following a larger-than-expected drop in US crude inventories. The chart below shows that US crude oil stockpiles dropped by 6.014 million barrels for the week ended August 15, 2025, according to data from the EIA.
Brent crude oil (BCO) formed a bottom at $65.50, while WTI crude oil (CL) rebounded from $61.50. The previous day saw losses in the oil market amid optimism over Ukraine peace negotiations. However, lingering uncertainty and conflicting statements from involved parties kept market conditions volatile.
Moreover, comments from Donald Trump added to the uncertainty. While he ruled out sending US troops to Ukraine, he hinted at possible air support. Meanwhile, Russia warned that excluding Moscow from security talks was "a road to nowhere." Any breakthrough could lead to sanctions relief and increased Russian oil exports, potentially pressuring prices.
Meanwhile, oil flows between Russia and Asia remain active. India has resumed purchases of discounted Russian crude for fall delivery, despite new US tariffs. Russia confirmed its ongoing supply to India and called for trilateral talks with China. This backdrop of steady demand and restricted supply continues to support oil prices, even as the Russia-Ukraine conflict unfolds.
WTI Crude Oil (CL) Technical Analysis
WTI Oil Daily Chart – Bearish Pressure
The daily chart for WTI Crude Oil shows price uncertainty within a broader bearish trend. Prices are attempting a rebound from current levels toward the $64 resistance zone. However, the 50-day SMA remains below the 200-day SMA, indicating continued negative momentum.
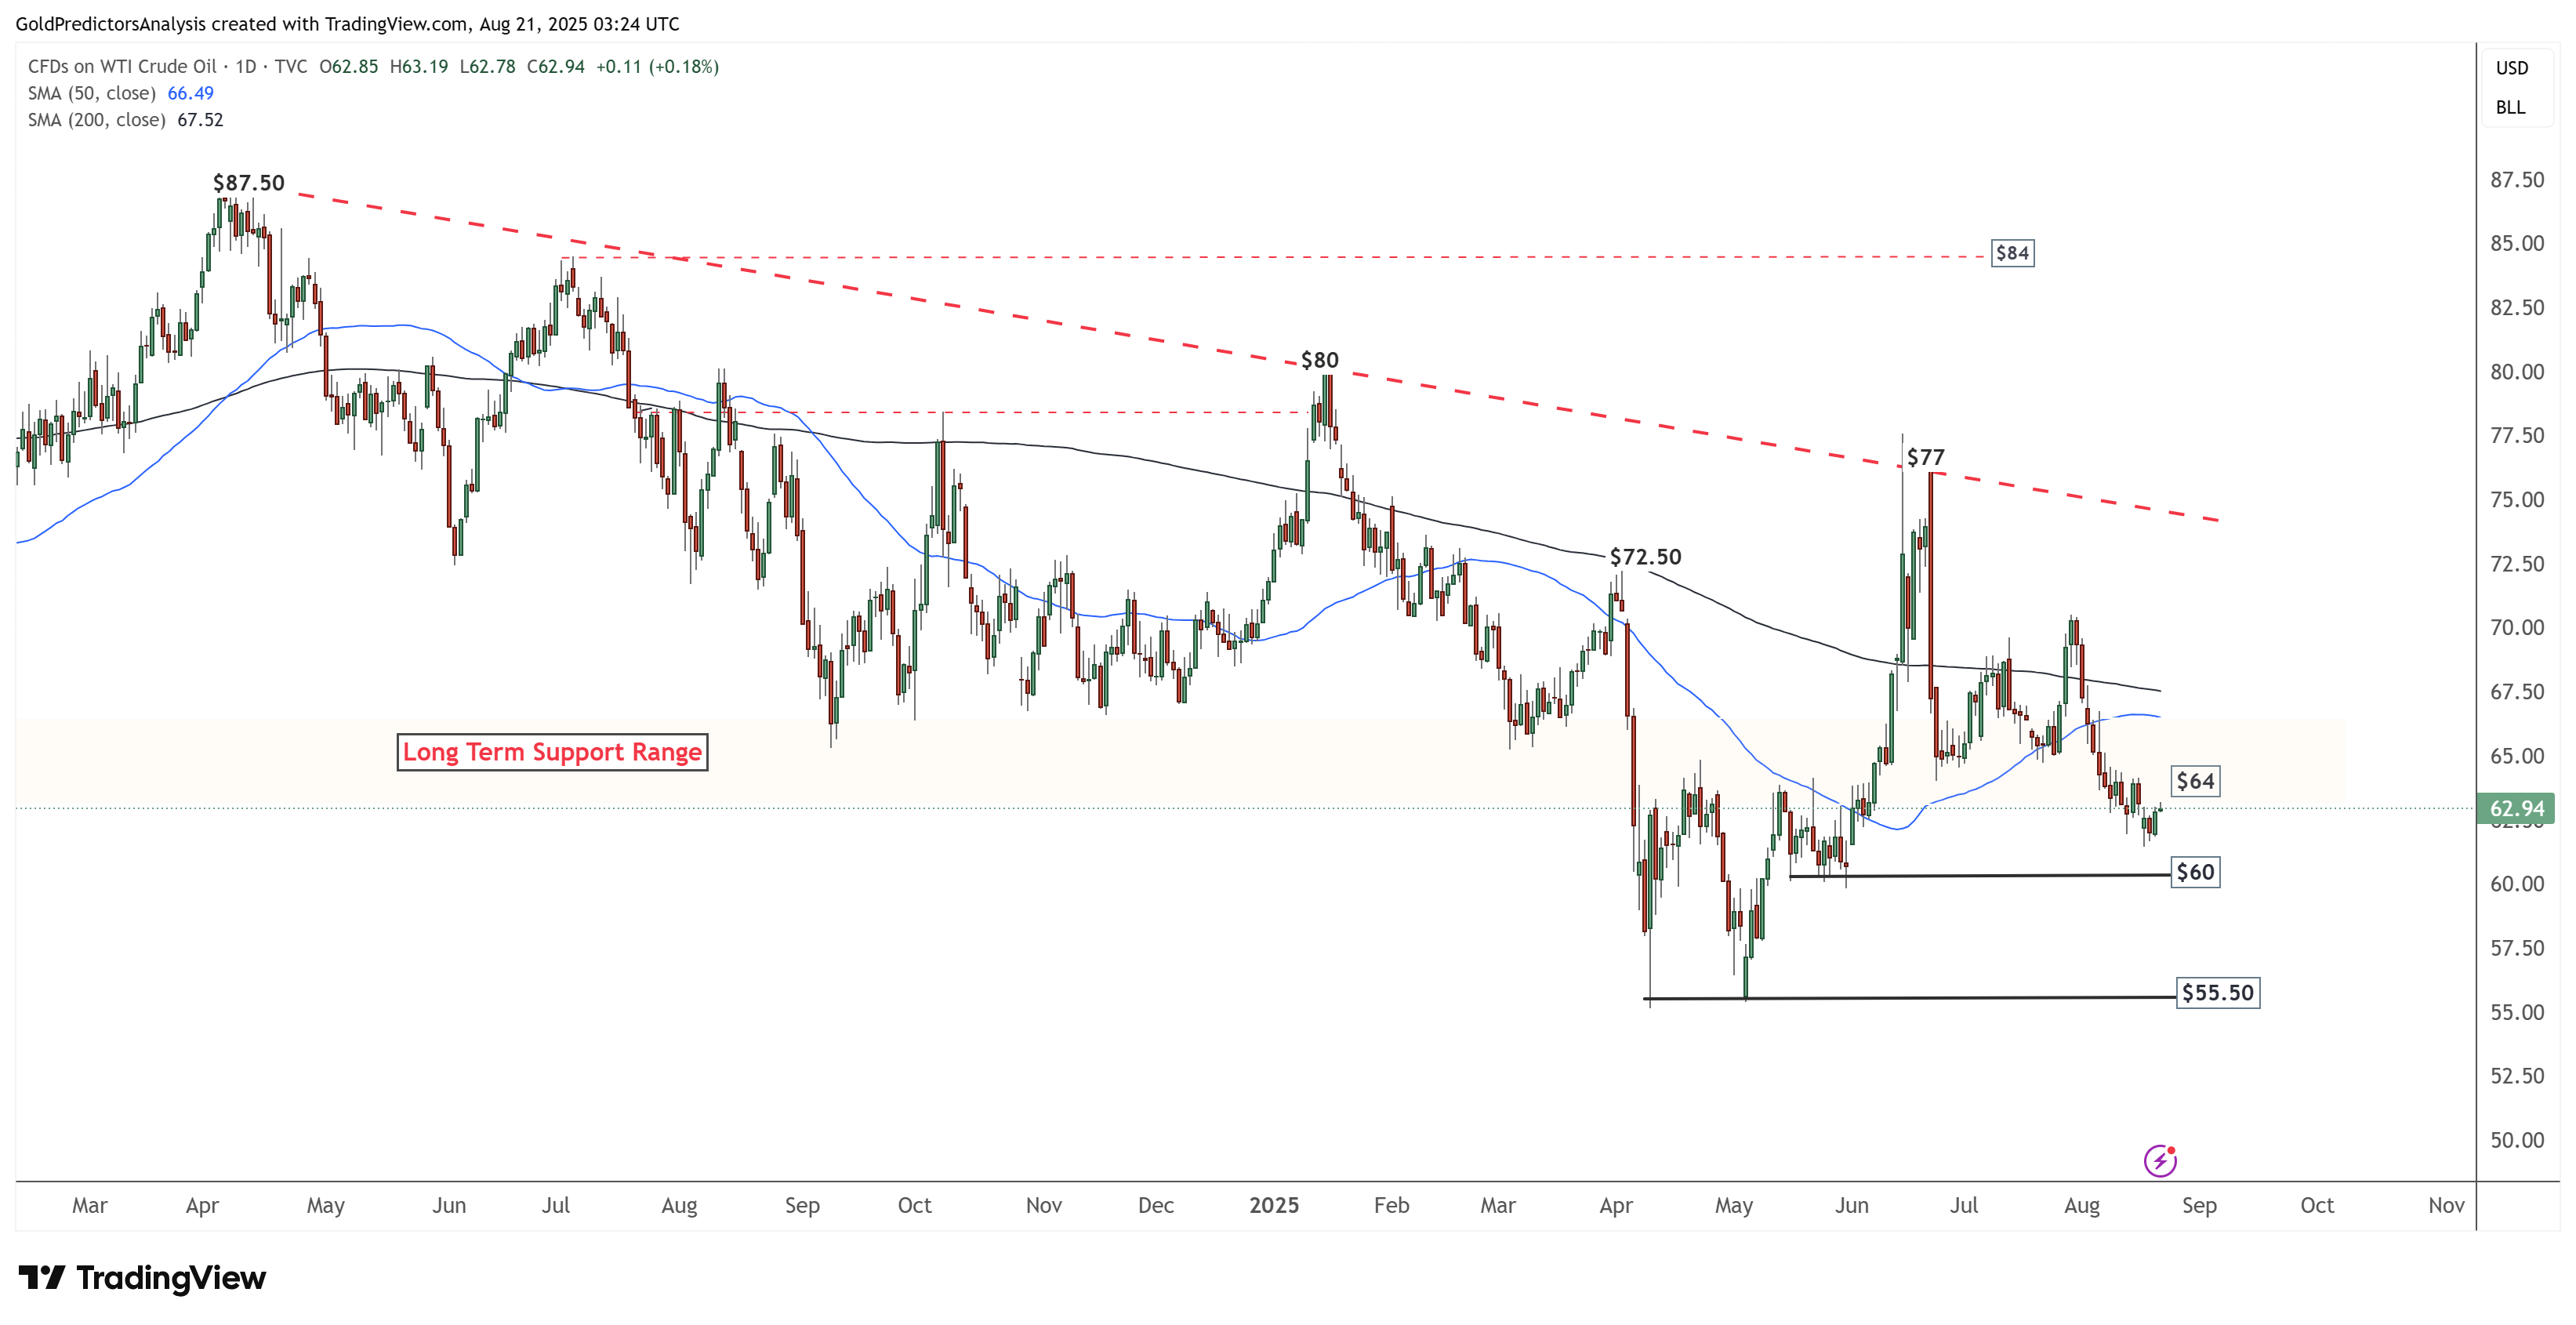
Immediate support lies near the $60 level. A break below this area could push oil prices further down toward the $55.50 region. On the upside, a break above $64 may open the path toward the $68–$70 range.
Despite the current rebound, the bearish structure remains intact. The downward-sloping moving averages reinforce the likelihood of further downside pressure.
WTI Oil 4-Hour Chart – Consolidation with Bearish Bias
The 4-hour chart for WTI crude oil shows bearish pressure on prices. This pressure is reflected in the double top pattern formed in June, followed by a prolonged consolidation phase in July. The July consolidation eventually broke the $64 support, reinforcing the bearish outlook.
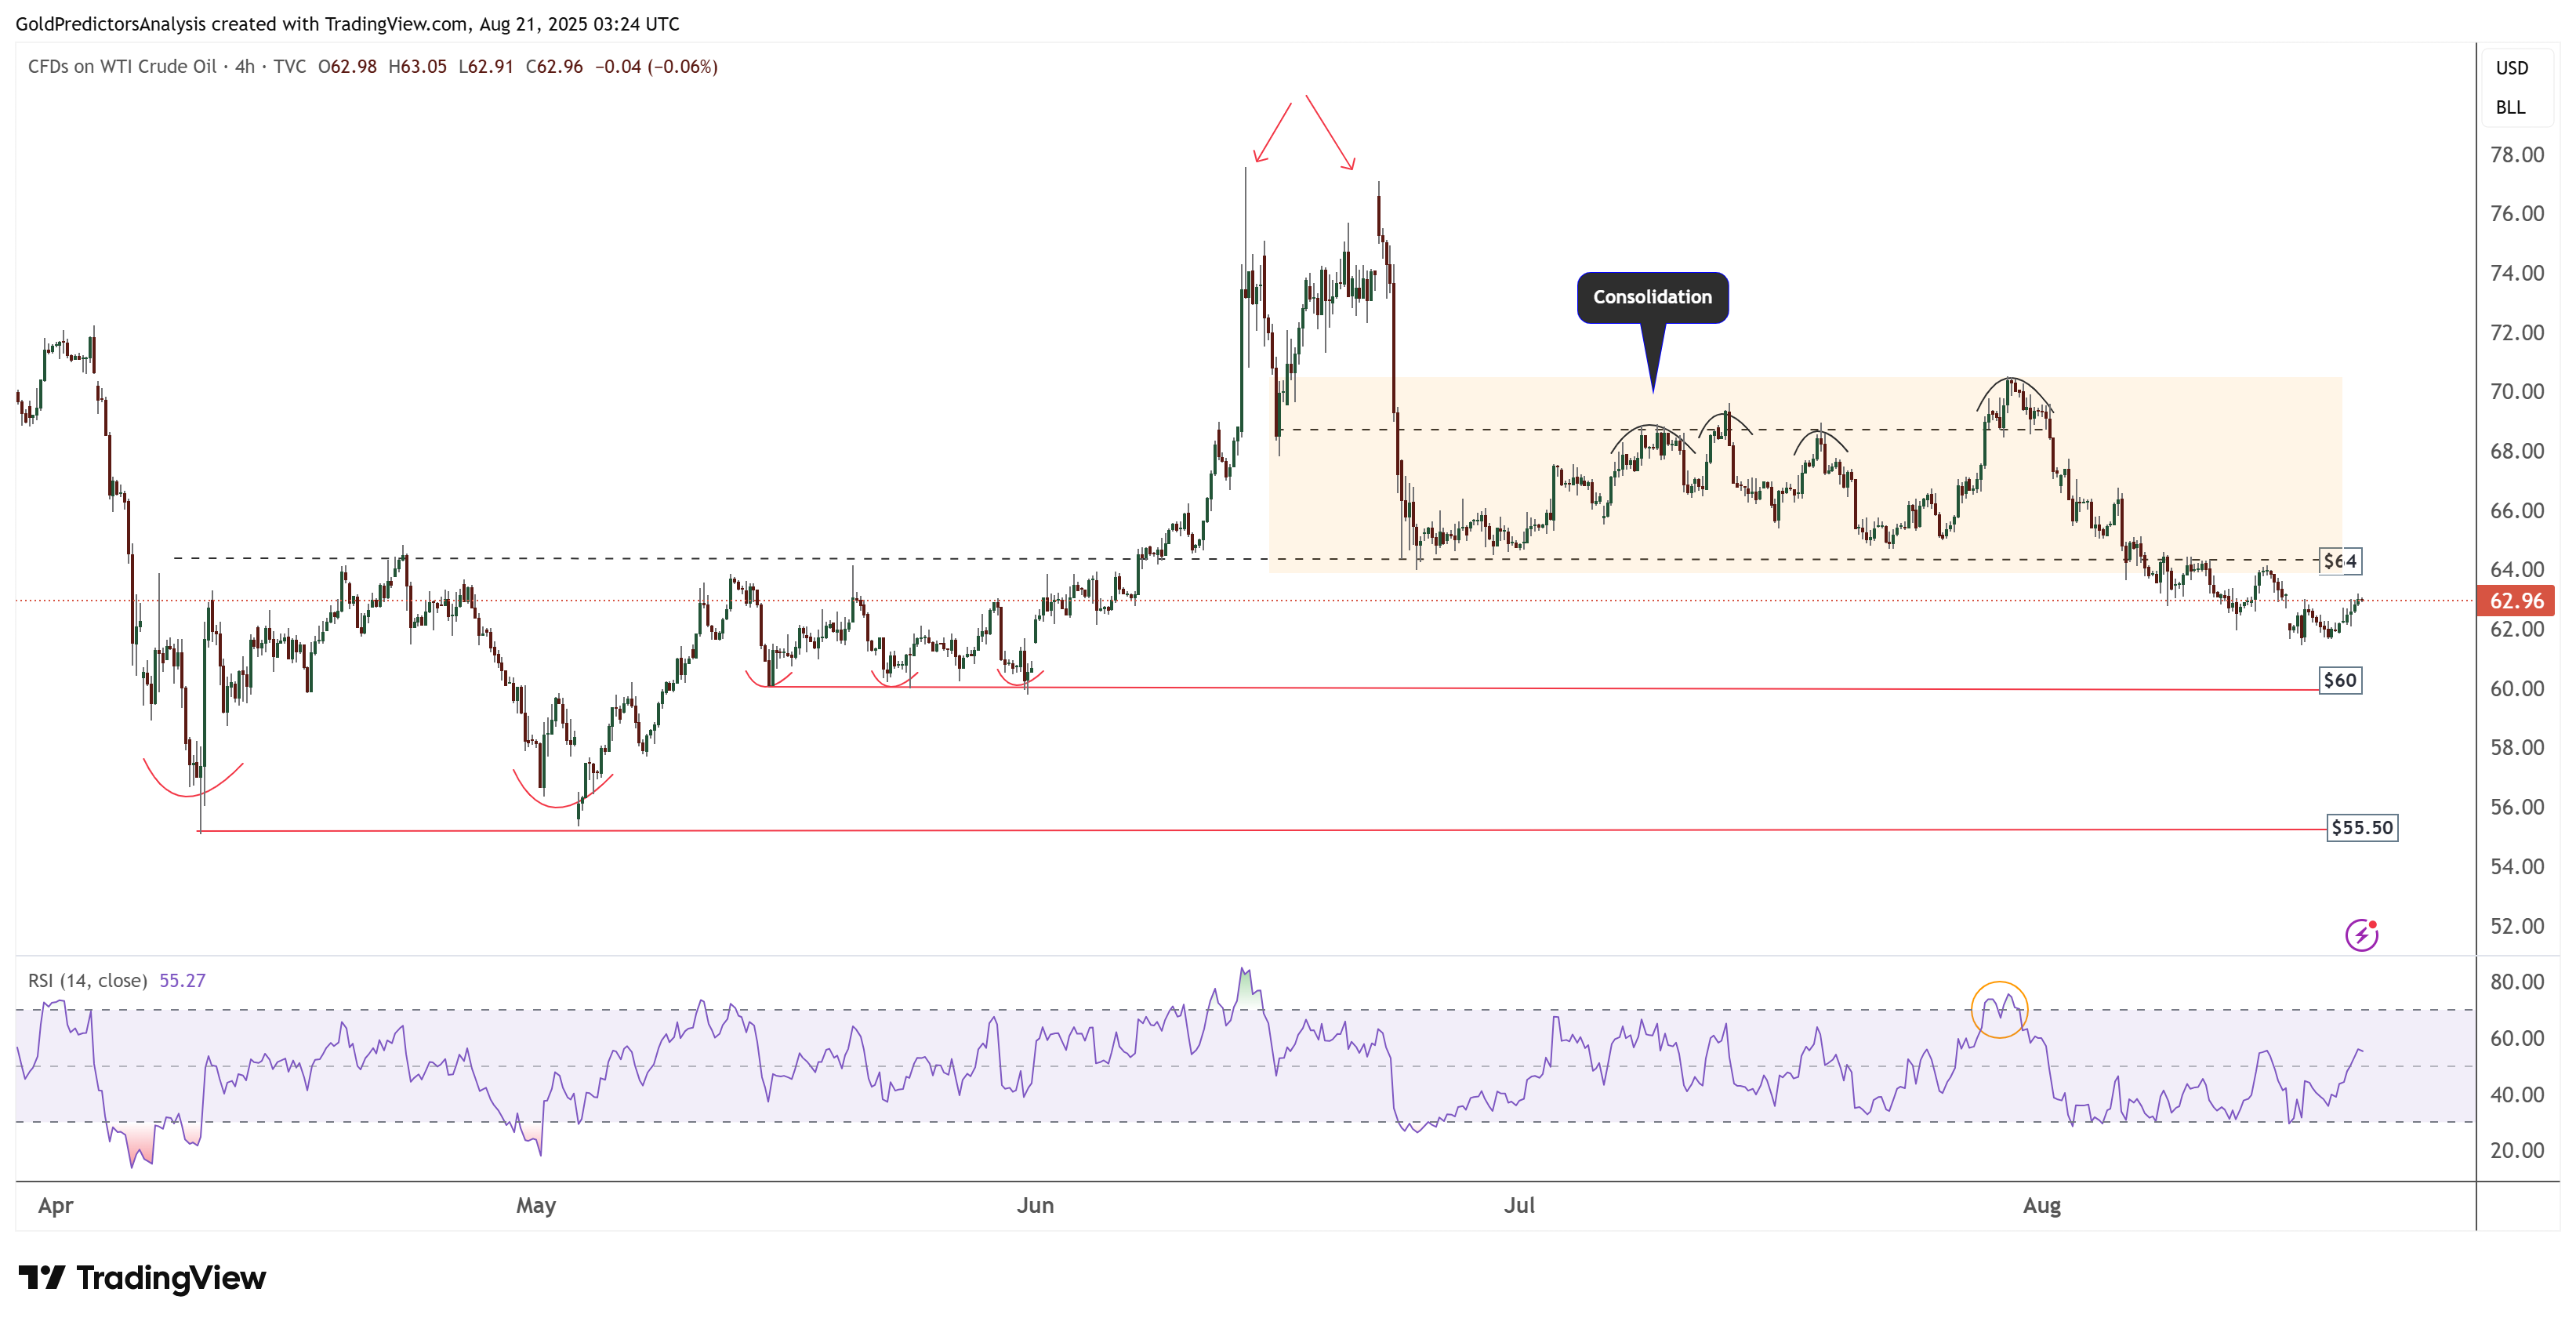
However, oil prices remain uncertain and directionless amid ongoing geopolitical tensions in the Middle East and Russia.
Natural Gas (NG) Technical Analysis
Natural Gas Daily Chart – Support of $2.60-$2.70
The daily chart for Natural gas (NG) also shows continued bearish pressure. However, despite this weakness, prices have approached the long-term support zone between $2.60 and $2.70. This area coincides with the neckline of the cup and handle pattern that formed during 2024.
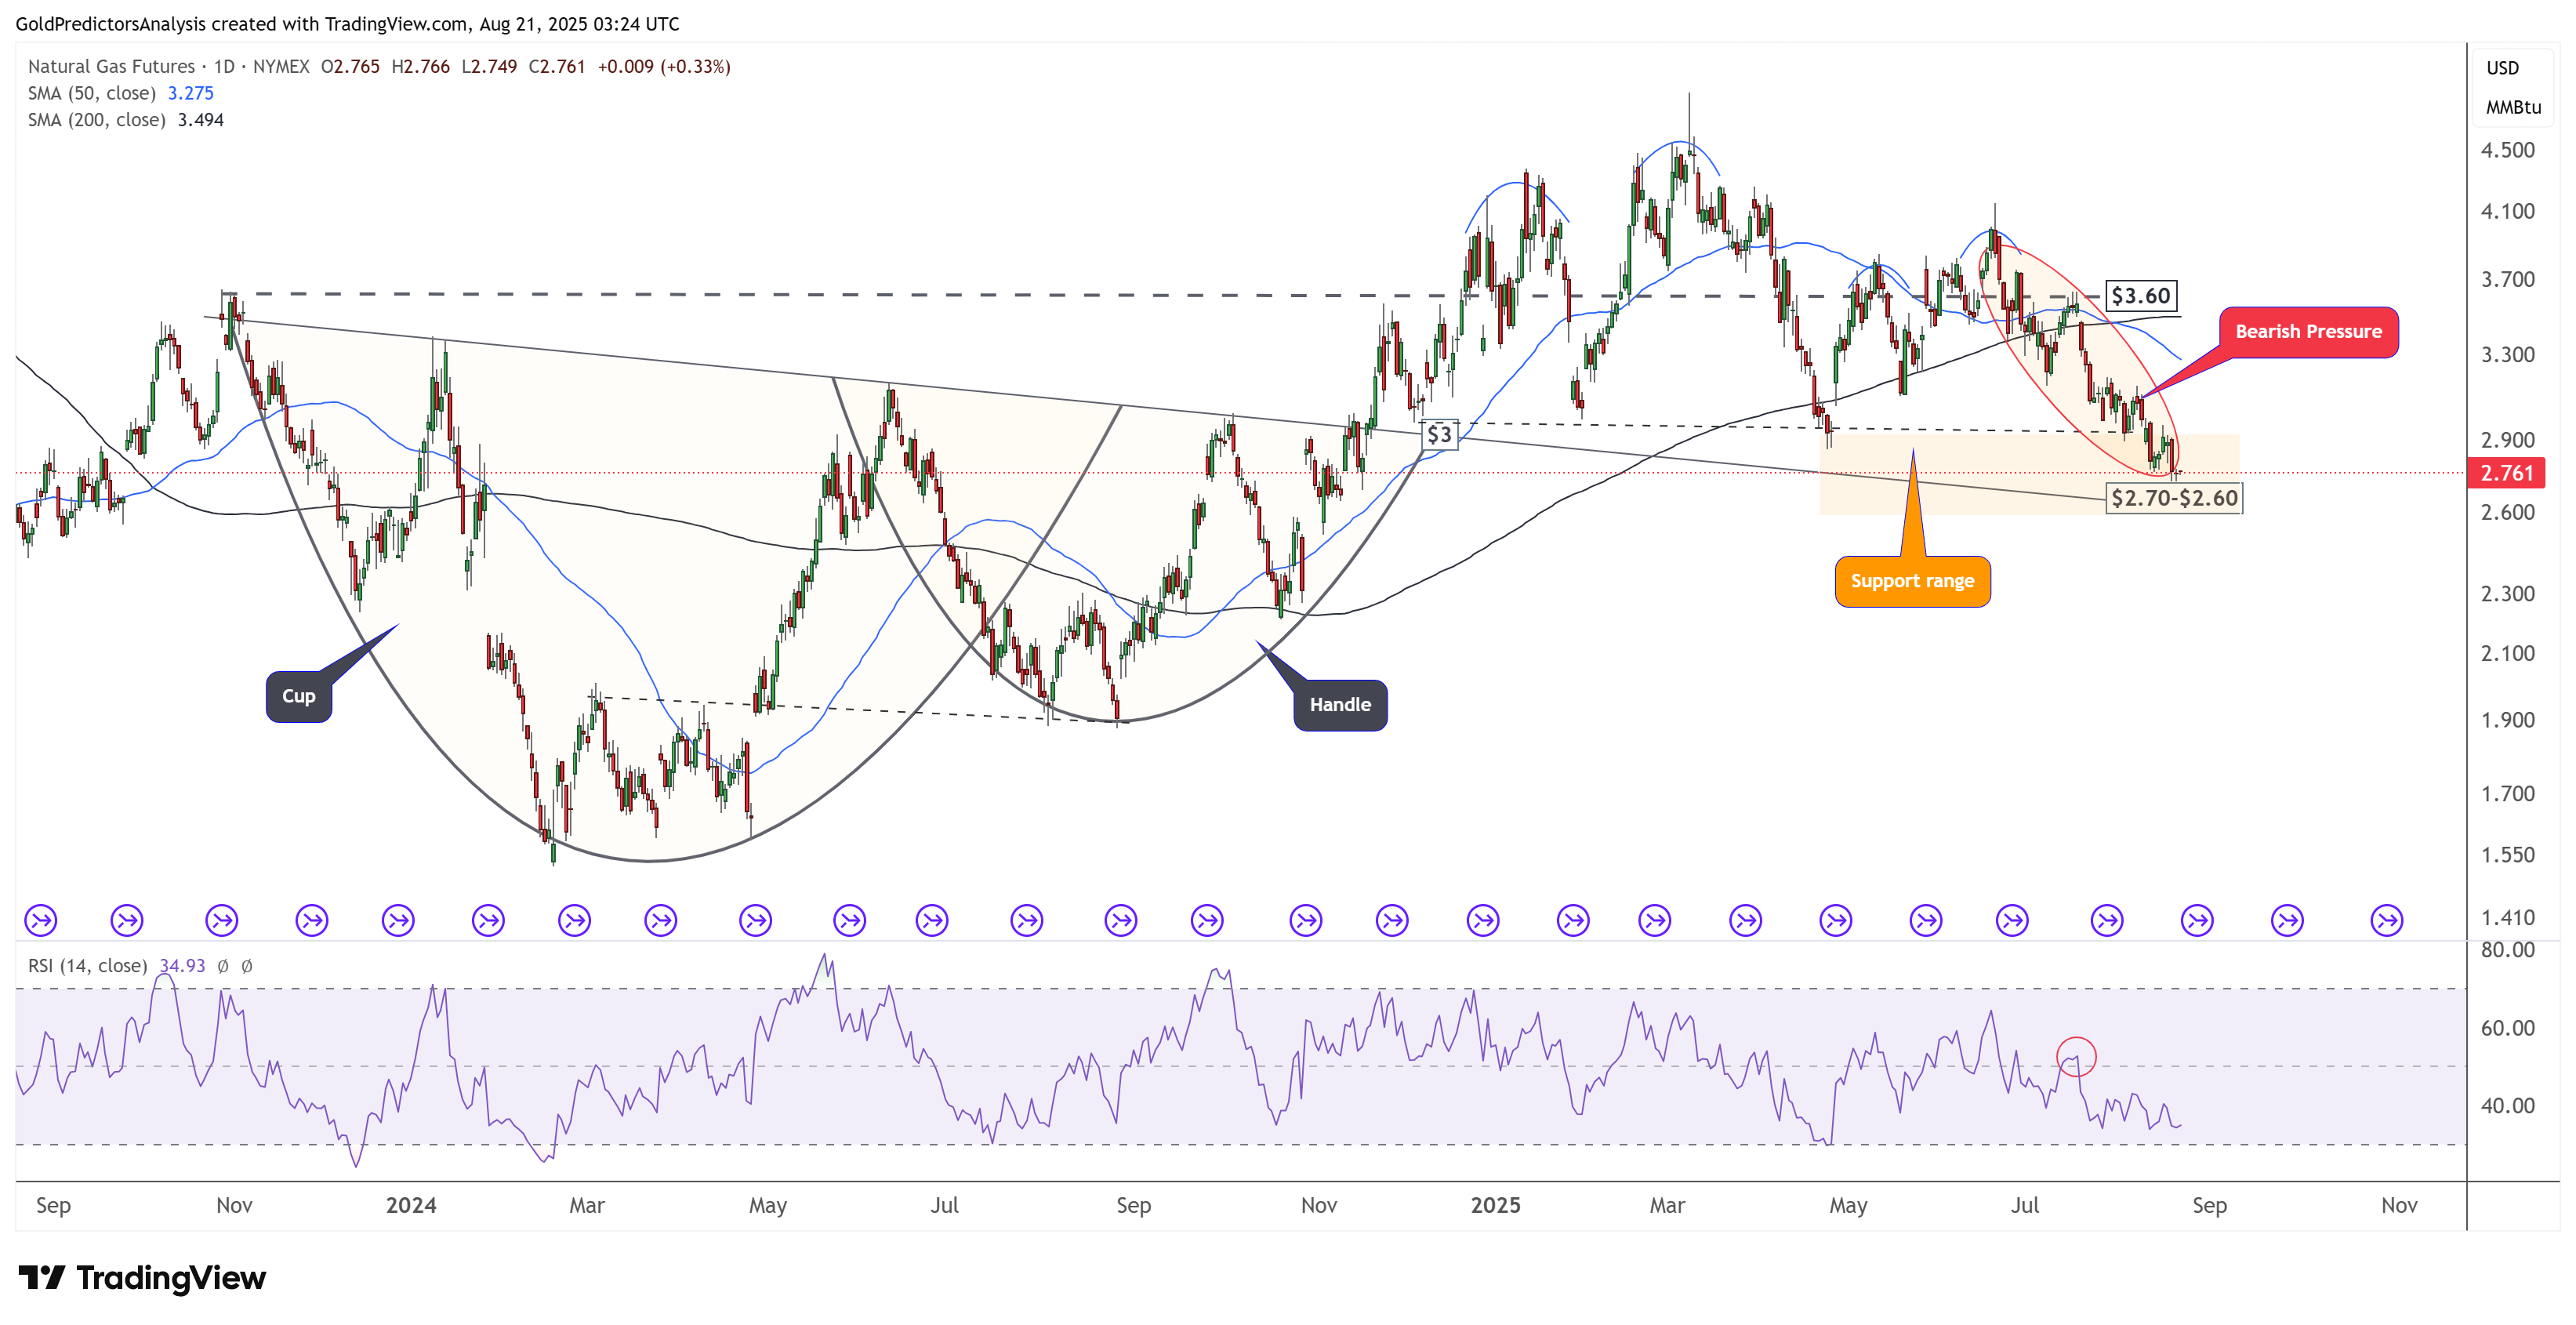
As long as this support holds, natural gas prices may see a rebound toward the $3.00 region. For a stronger bullish case, a breakout above the $3.60 level is needed, which could open the path toward the $5.00 area.
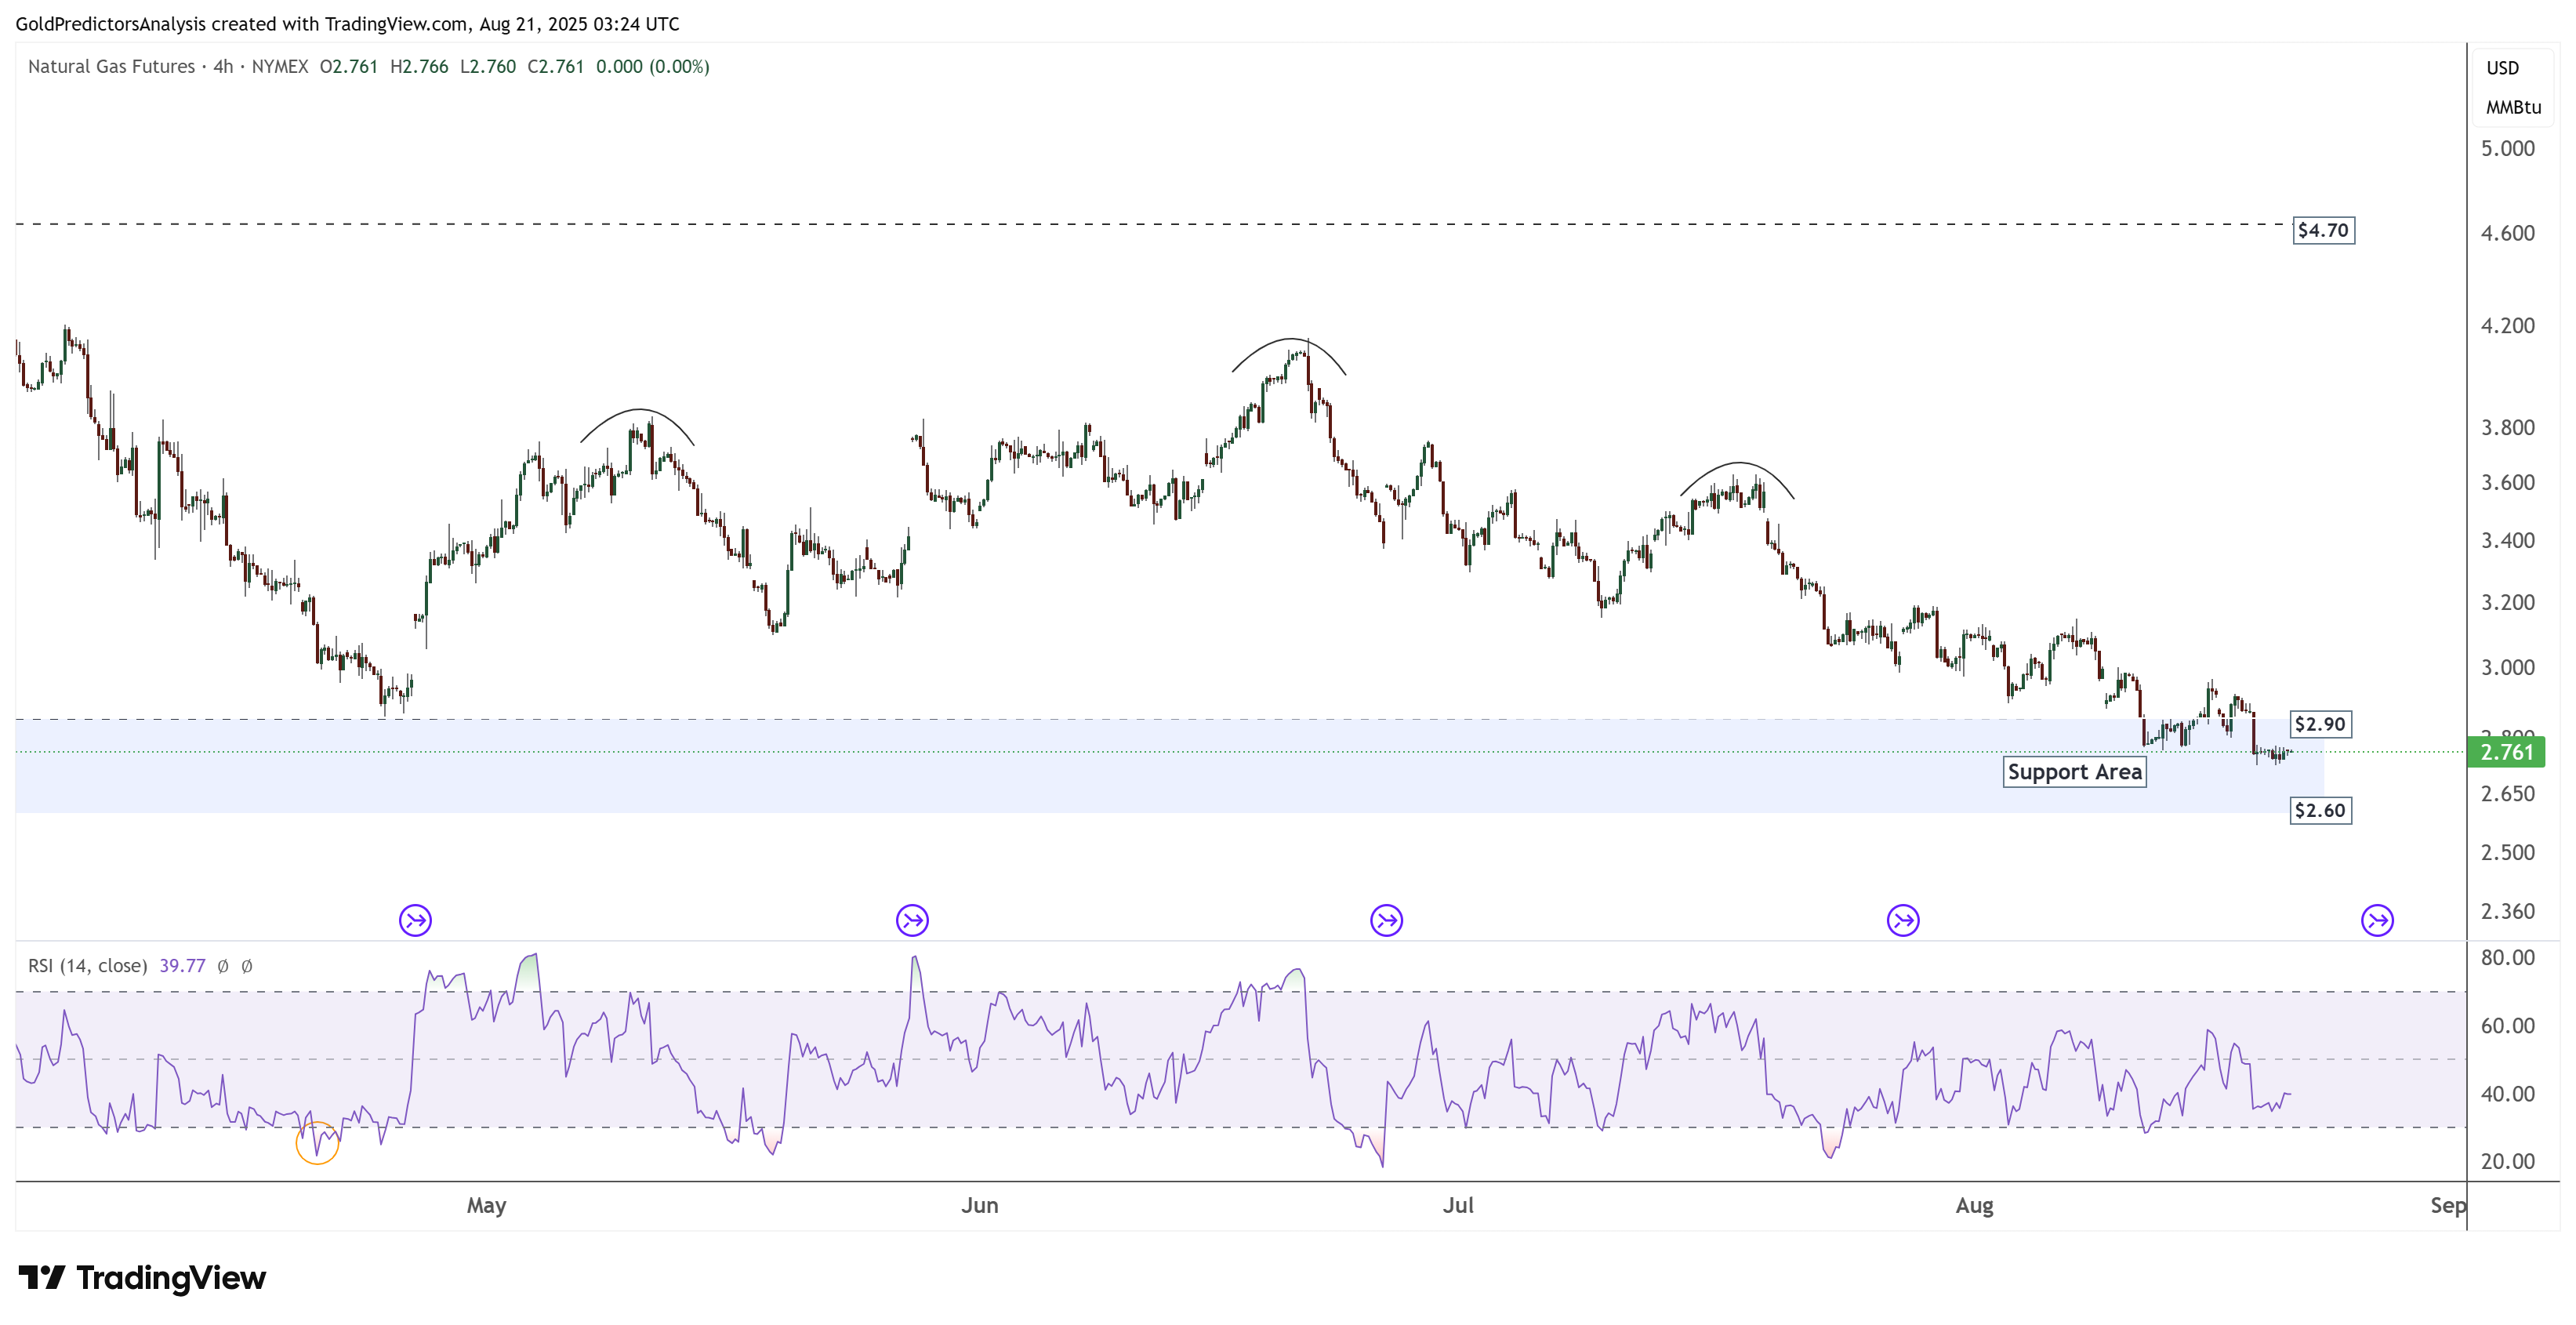
Natural Gas 4-Hour Chart – Support Area
The 4-hour chart for natural gas shows that prices have approached a strong support area between $2.60 and $2.90. As long as this range holds, consolidation is likely within these levels. However, a break below $2.60 could be bearish and push prices further lower. Conversely, a breakout above the $3.00 region may lead natural gas prices higher toward the $3.60 to $4.00 area.
US Dollar Index (DXY) Technical Analysis
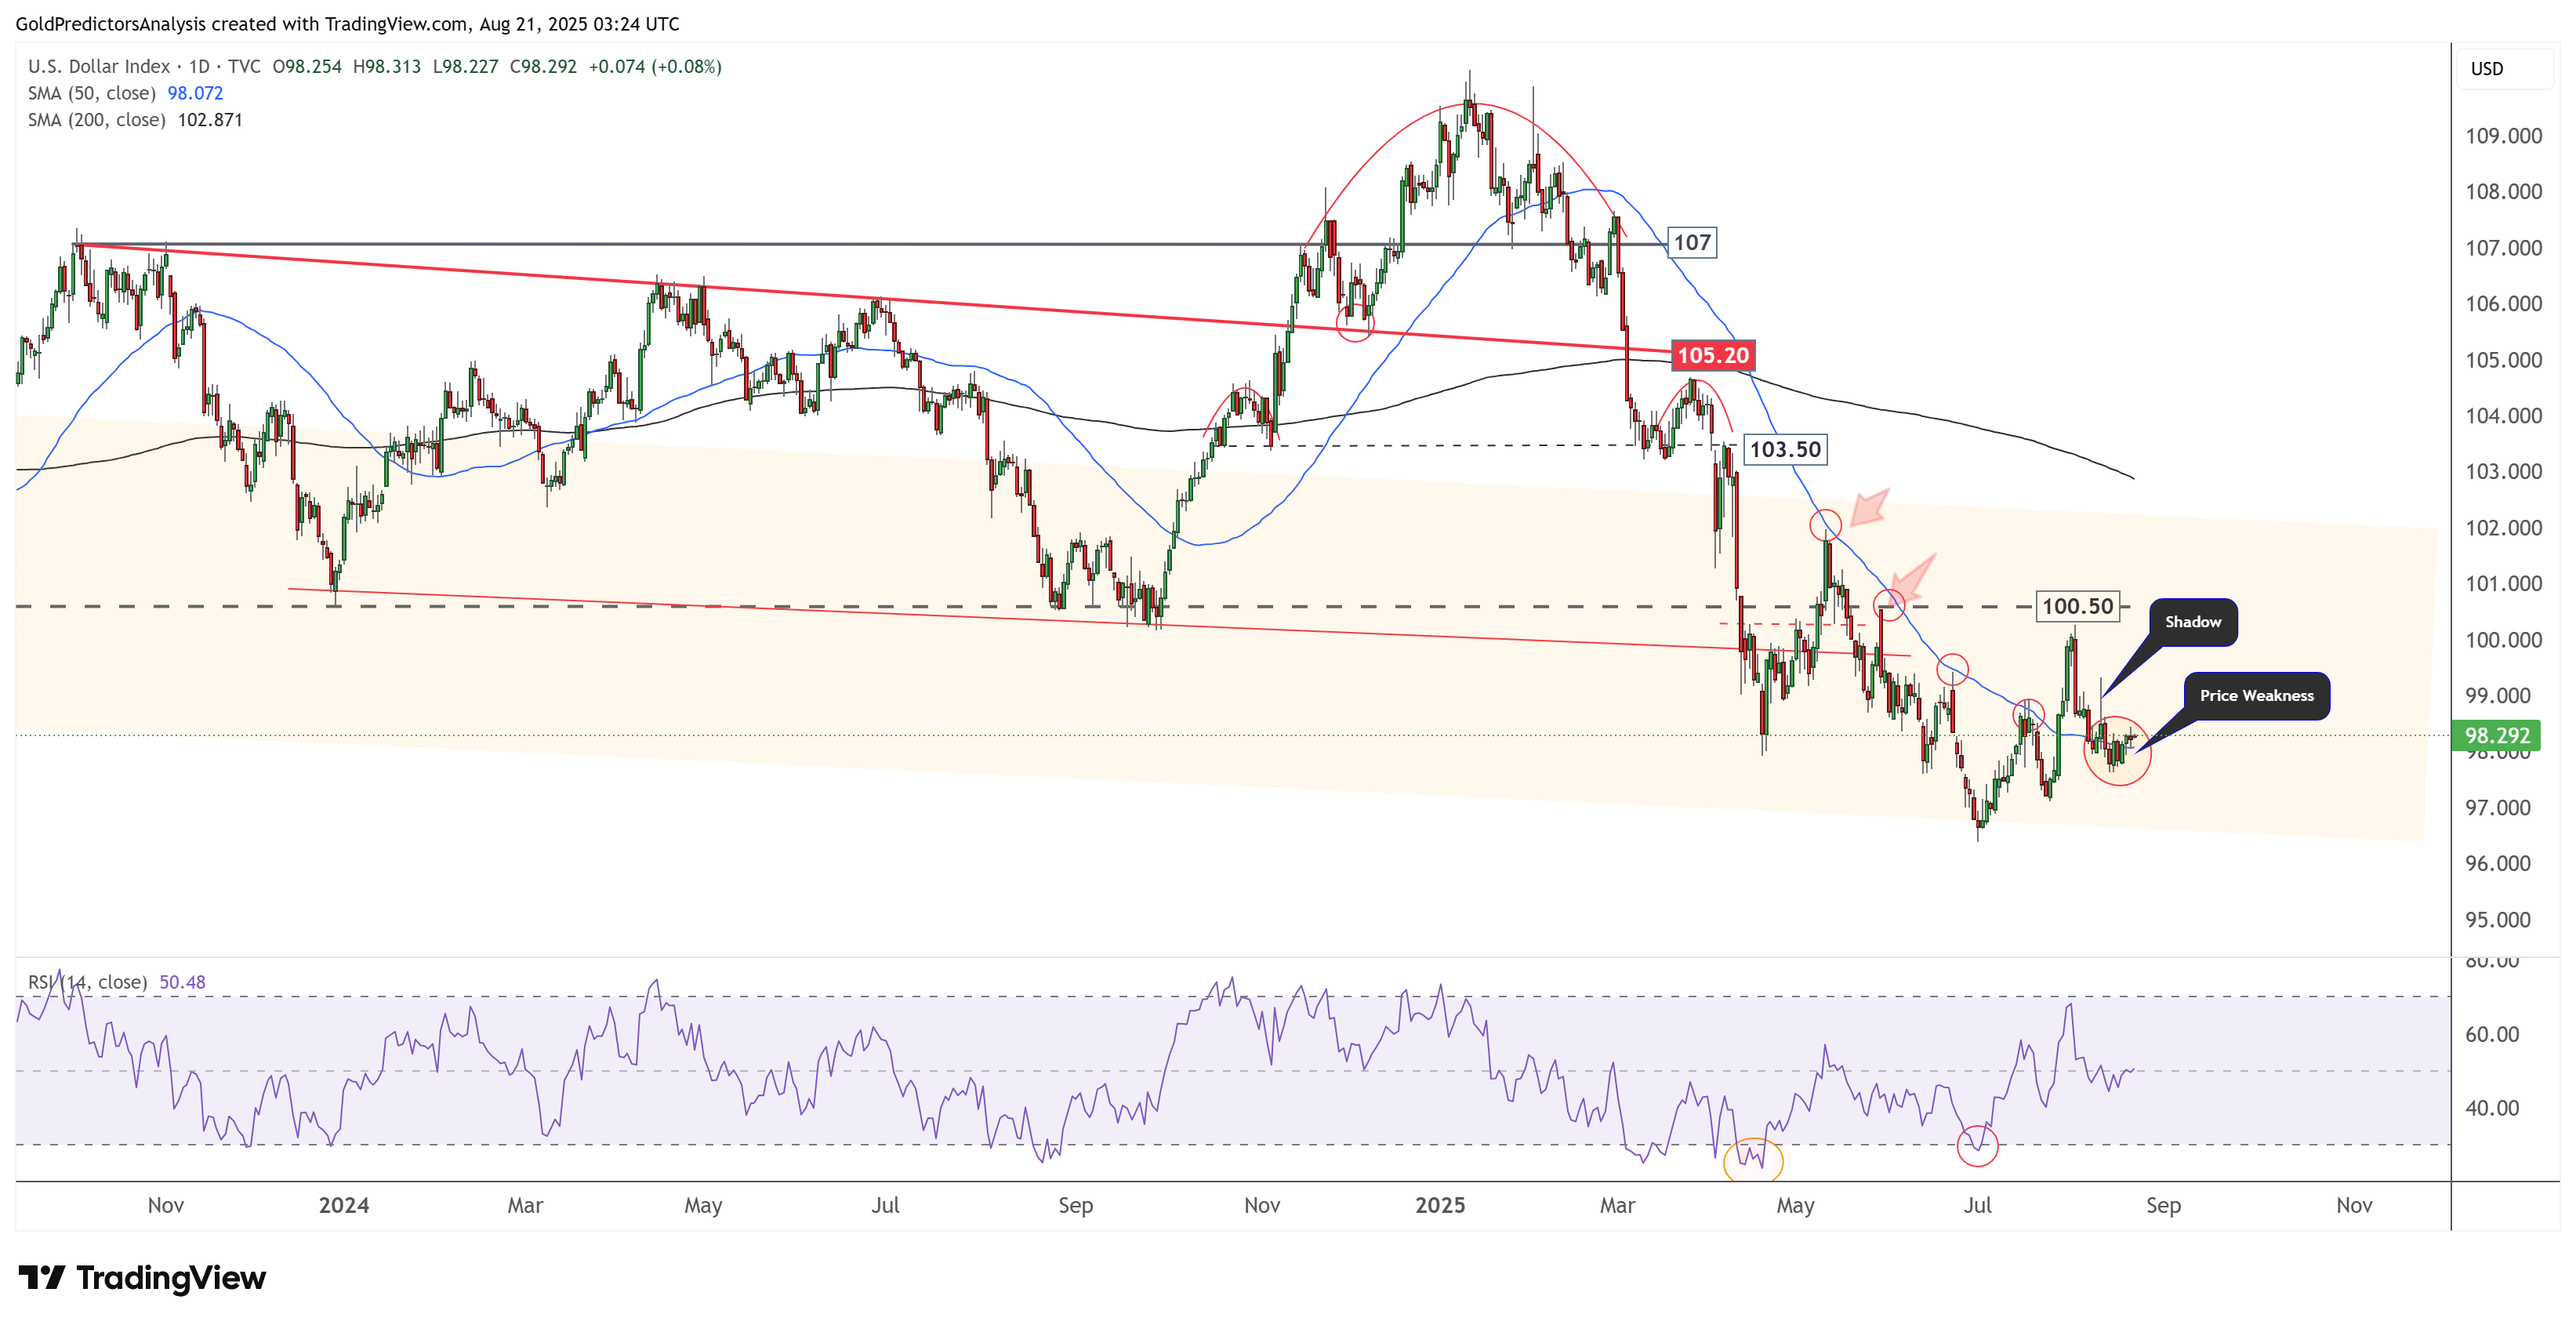
US Dollar Daily Chart – Bearish Pressure
The daily chart for the US Dollar Index shows that it is forming a bearish price structure after a decline in 2025. Despite this weakness, the index is attempting a rebound from the long-term support near the 96 area.
The US Dollar Index is consolidating around the 50-day SMA, indicating continued price weakness. A break below the 96 level could trigger a sharp decline toward the 90 region. On the other hand, a break above 100.50 will indicate further upside to 102.
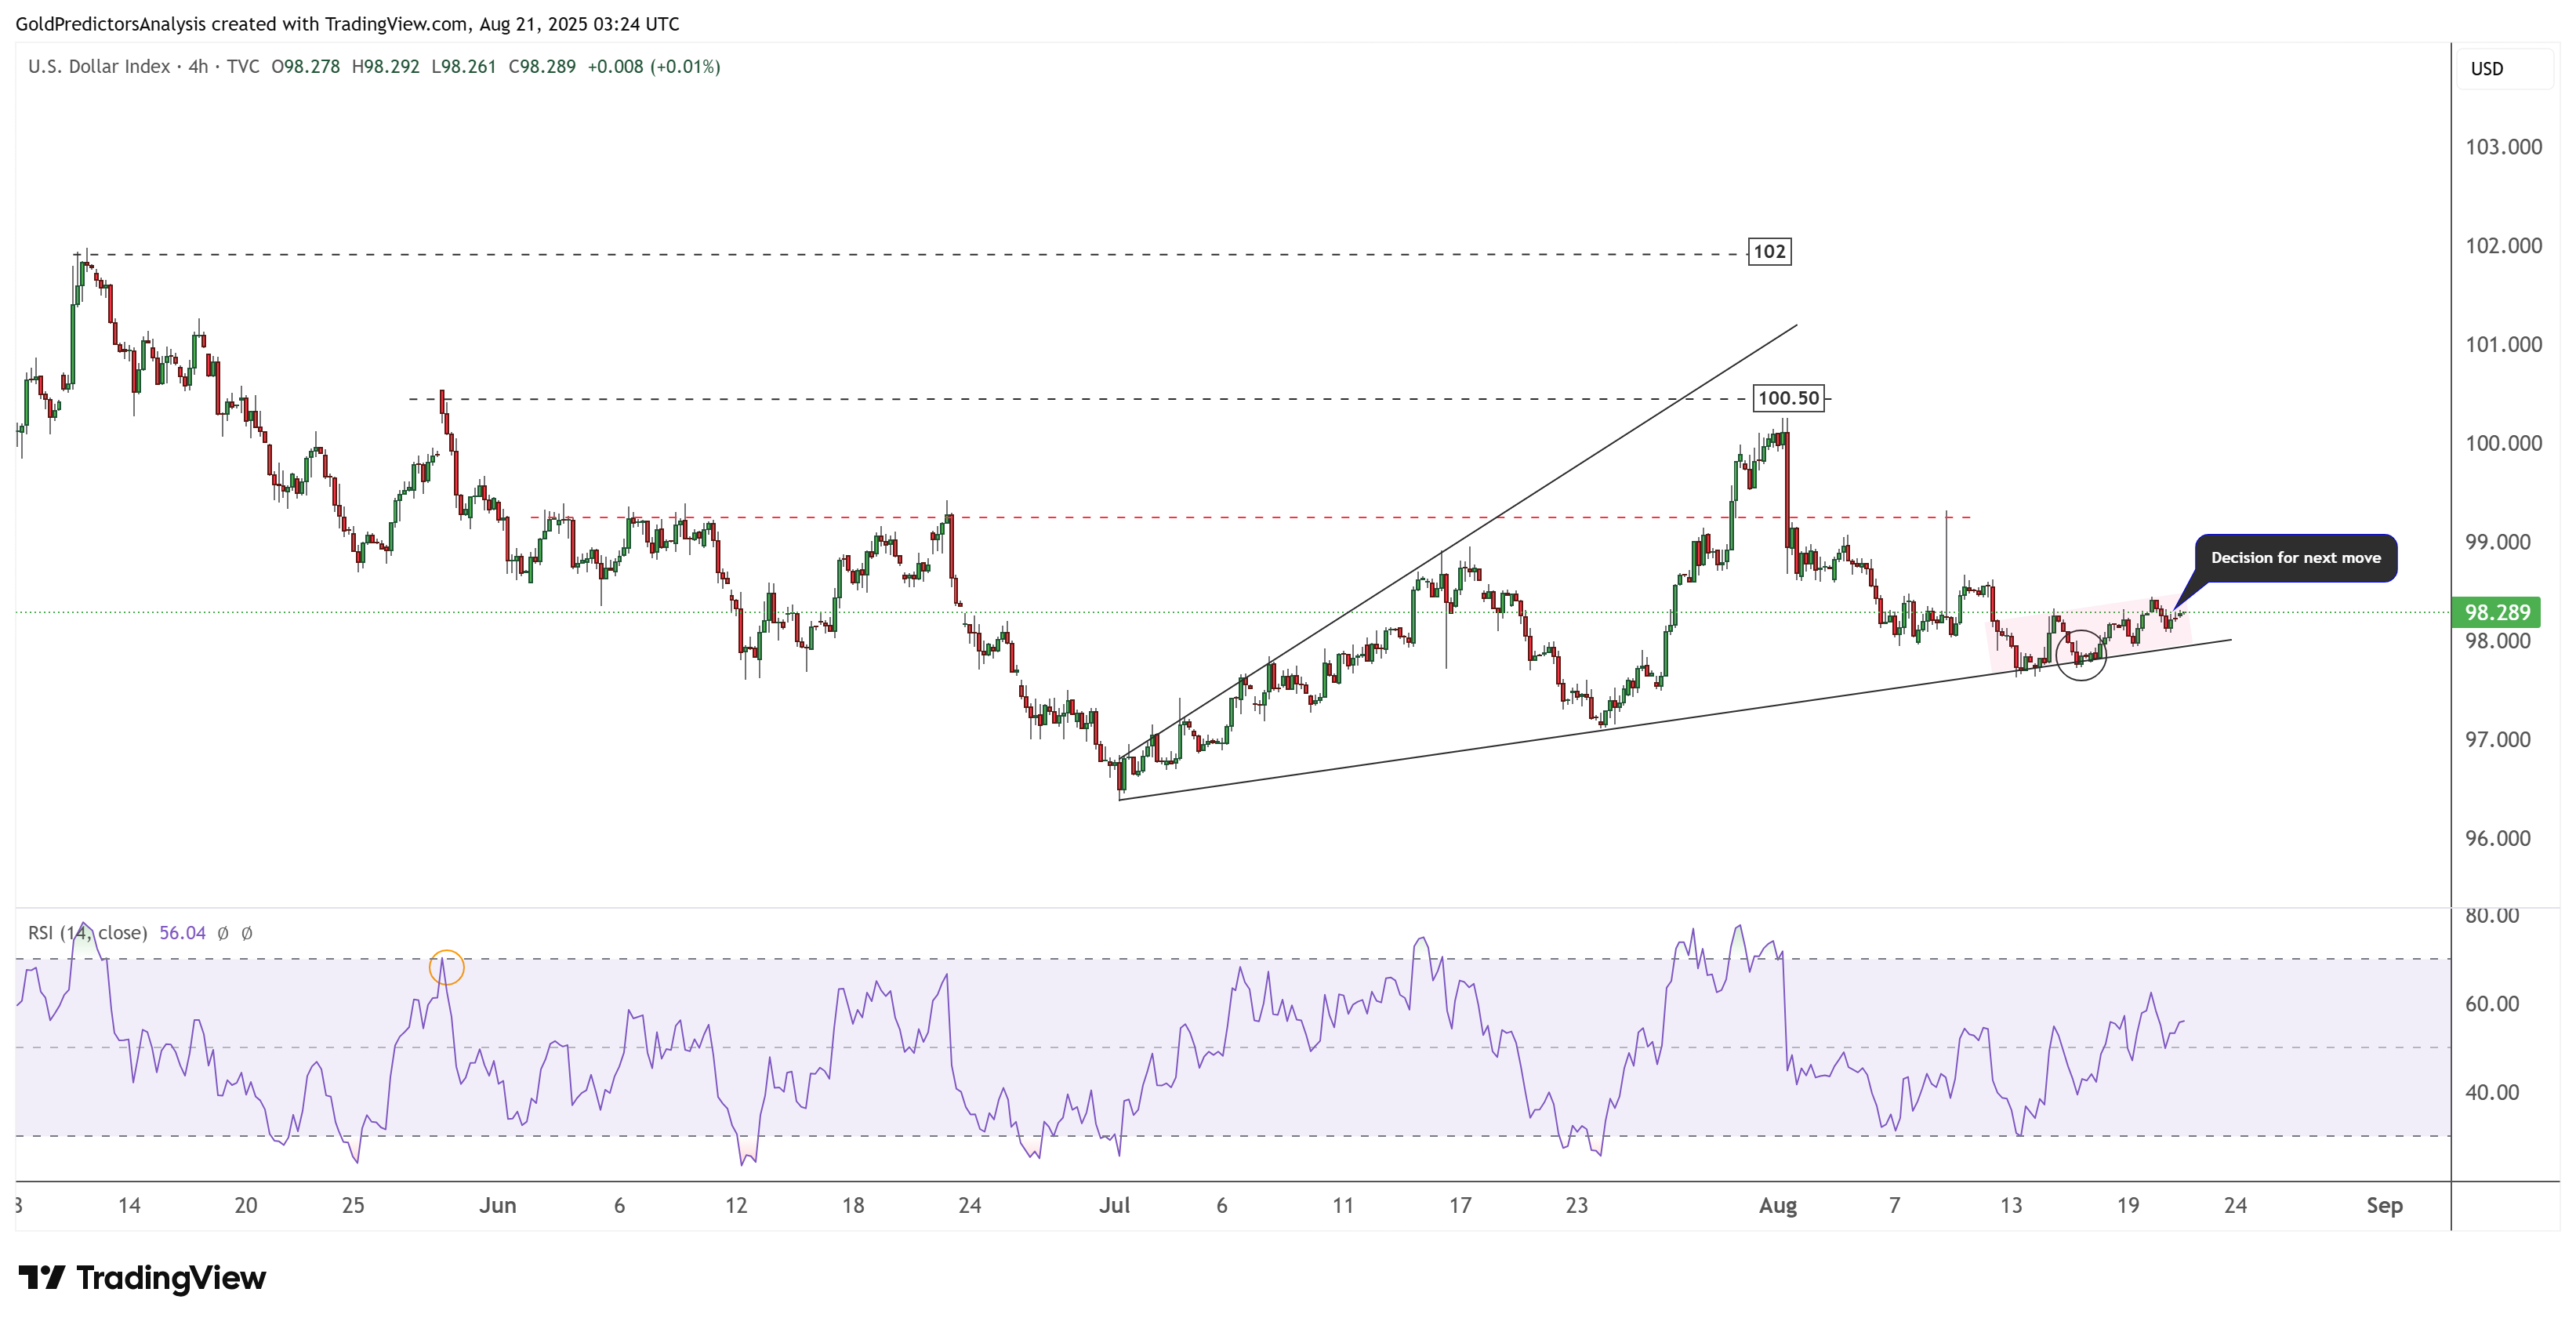
US Dollar 4-Hour Chart – Negative Price Action
The consolidation in the US Dollar Index is also visible on the 4-hour chart, as highlighted by the red-shaded area. The index is currently consolidating at the support of an ascending broadening wedge pattern.
A break below this support would be bearish and could push the index lower. However, a rebound from this support toward the 99.20 level may occur. However, this rebound would likely be temporary and would not change the overall bearish price structure in the US Dollar Index.